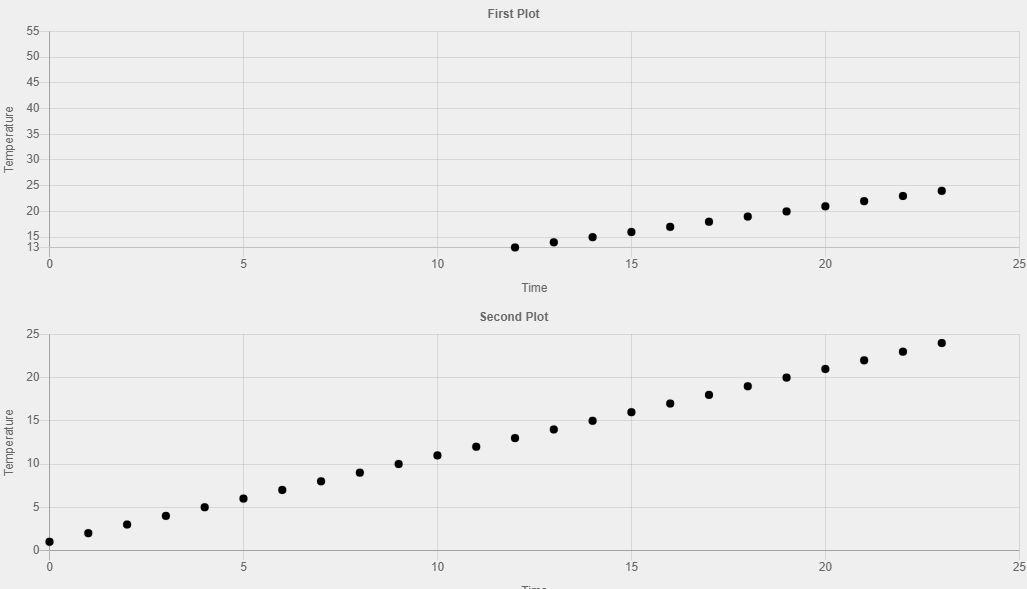
Data can be added to plots within the LbyM app through Logo code. Currently, all commands can be found in the starter project "Plotting Demo". As of this writing only scatter plots are supported with single data sets.

To define a new plot, first use the keywords to set all relevant options. Then create the plot with the function 'show-plot'. Required options include plot position, x-data and y-data. The data sources should be variables, and those variables should be arrays. The chart will listen for changes to the defined variables and will update when the data is updated.
Example:
to make-plot
  one-plot
  x-label "Time
  y-label "Data
  x-data "xDataOne
  y-data "yDataOne
  show-plot
end
Plots can be made with multiple data sources by passing an array in place of the string for x-data or y-data. Sources are paired in order between the arrays. If one axis only has one data source it will be used with all data sources on the other axis. This is most commonly used with time on the x axis.
to plot-two-things
  one-plot
  x-label 'Time'
  y-label 'Data'
  x-data 'time-list'
  y-data ['thing1-data' 'thing2-data']
end
Options
| Function Name | Input Type | Default | Description |
|---|---|---|---|
| one-plot / bottom-plot / top-plot | None | No default - required | Define the position of the plot to be created |
| plot-title | String | undefined | Set title text for plot |
| x-label | String | undefined | Set text to label x-axis |
| y-label | String | undefined | Set text to label y-axis |
| x-data | String (variable name) or array | No default - required | Set variable to map to x axis |
| y-data | String (variable name) or array | No default - required | Set variable to map to y axis |
| limits-x | Numbers (2) | undefined | Set domain (number range of x axis) between two numbers |
| limits-y | Numbers (2) | undefined | Set range (number range of y axis) between two numbers |
| limits | Numbers (4) | undefined | Set domain and range [xmin, xmax, ymin, ymax] |
| x-ticks | Numbers | undefined | Set step size of tick marks on x axis |
| y-ticks | Numbers | undefined | Set step size of tick marks on y axis |
After setting options, calling "show-plot" is necessary in order to generate the plot in the 'plots' tab.